

Facebook Ads Reporting: Master Your Data in 2026
Master Facebook Ads reporting. Track KPIs, build dashboards, automate workflows & create a single source of truth for agencies & growth teams. Get started in
Master Facebook Ads reporting. Track KPIs, build dashboards, automate workflows & create a single source of truth for agencies & growth teams. Get started in
The weekly performance meeting starts the same way in a lot of teams. The media buyer opens Ads Manager and reports strong return. The ecommerce lead checks Shopify and sees a weaker picture. Finance has its own spend-to-revenue view, and suddenly the room is debating numbers instead of making decisions.
That's usually not a performance problem first. It's a reporting problem.
Good Facebook Ads reporting doesn't just tell one buyer what happened in one ad account. It gives the creative team, growth lead, ecommerce operator, and finance partner a shared way to read performance. When that shared view is missing, teams overreact to noise, underfund winners, and lose trust in the data stack they're supposed to rely on.
A lot of reporting problems look like channel problems on the surface.
A team sees Meta reporting one result, the store platform showing another, and a blended dashboard showing something else again. The first reaction is usually to ask which platform is wrong. The better question is which system is answering which business question.
That distinction matters more as teams grow. A solo buyer can get away with loose definitions for a while. An enterprise growth team can't. Once multiple media buyers, creative strategists, account managers, analysts, and finance stakeholders are involved, loose definitions turn into operational drag. One person optimizes to in-platform purchases. Another cares about blended efficiency. A third wants margin impact. Everyone is looking at a real number, but not the same number.
Practical rule: If two teams are arguing about ROAS, stop debating performance and define the metric before the next meeting.
The fix isn't another dashboard tab. It's governance.
That means agreeing on a reporting language across the team. Define which metrics are directional, which are financial, which are for optimization only, and which data source wins when numbers conflict. Once that's in place, Facebook Ads reporting becomes less about exporting charts and more about building team clarity.
In practice, strong teams do a few things consistently:
Once that discipline exists, the meeting changes. People stop asking whose screenshot is right and start asking what action the team should take next.
A common failure point shows up in Monday reporting meetings. The media buyer opens Ads Manager. Ecommerce has Shopify open. Finance is looking at contribution margin in a spreadsheet. Everyone has a different question, so everyone brings a different number. Reporting only starts helping once the team separates two jobs clearly: operating the account and judging whether the spend produced a business result.

One report rarely does both jobs well. Teams that force daily optimization metrics and executive decision metrics into the same view usually end up with crowded dashboards and vague meetings.
Performance tracking is the operating layer. It supports day-to-day decisions inside Ads Manager or in a live dashboard used by buyers, creative strategists, and channel leads.
The point is speed. Teams use these metrics to catch delivery issues, spot creative fatigue, and decide where to shift budget before waste builds. Common examples include impressions, clicks, click-through rate, landing page views, cost per result, and conversion rate. If your team needs a clean reference for which numbers belong in this layer, this breakdown of Facebook ad metrics for optimal ROAS and ROI is a useful starting point.
Questions at this layer are practical:
These metrics help teams act. They are shared working signals, not final proof of channel value.
Success measurement is the business layer. It looks at whether paid social produced results the company should keep funding after returns, lead quality, margin, and sales validation are considered.
This is where cross-functional reporting matters most. Media teams may optimize toward in-platform purchases or leads. Leadership and finance care about whether those outcomes turned into profitable revenue or qualified pipeline. Agencies need this view too, because account health inside Meta can look fine while the client is unhappy for valid business reasons.
Metrics here usually include CPA, MER, ROAS, revenue contribution, new customer rate, lead quality, and CRM or ecommerce validation. The exact set depends on the business model. For ecommerce teams building this layer, these actionable steps for ecommerce KPIs are a practical companion to channel reporting.
A healthy account can still be a weak investment. Cheap traffic and stable CTR do not fix poor downstream economics.
The strongest reporting setups give these two jobs different audiences, different cadences, and often different owners. Buyers and creative teams need fast operational visibility. Growth leads need a joined-up view that connects platform performance to store or CRM outcomes. Finance needs stable definitions and fewer moving parts. Once those lanes are clear, reporting becomes easier to trust and much easier to use in a team setting.
A weekly performance review goes sideways fast when each team walks in with a different definition of success. The media buyer is watching CPC, the creative lead is proud of thumb-stop rate, the ecommerce manager cares about new customer revenue, and finance wants a number that ties back to the store. KPI discipline fixes that problem. It gives the team one shared framework for reading the account.
Benchmarks can help with orientation, but they are weak decision tools on their own. CPM and CPC shift by objective, market, offer, audience size, and creative format. Analysts at KlientBoost's Facebook ads statistics roundup found wide variance across campaign types. Treat outside benchmarks as context. Build decisions from your account structure, your margin profile, and your conversion path.
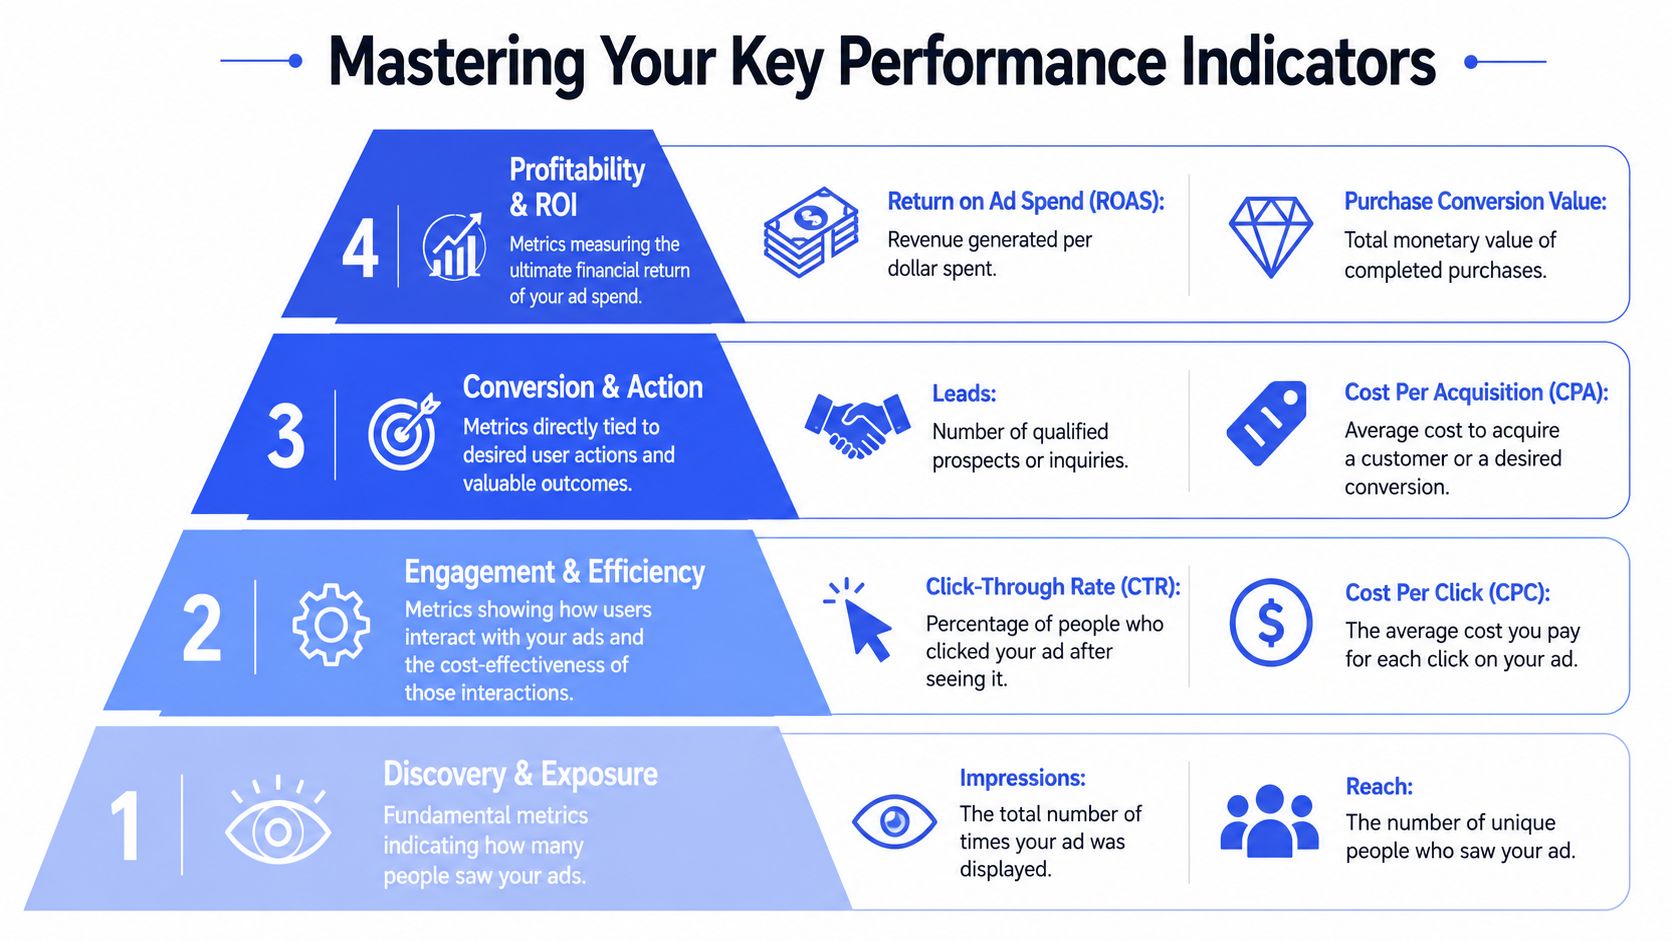
The simplest way to train a team is to organize metrics by job. Some metrics tell operators whether delivery is healthy. Others tell leadership whether the spend produced something worth scaling. When those jobs get mixed together, teams either overreact to noise or miss real problems.
| KPI layer | What it answers | Metrics to monitor | Team most likely to use it |
|---|---|---|---|
| Profitability | Is this channel producing acceptable economics | ROAS, purchase conversion value, CPA | Growth lead, finance, leadership |
| Conversion | Are people completing the action we pay for | Purchases, leads, qualified actions | Media buyers, lifecycle, sales ops |
| Engagement | Are ads earning attention efficiently | CTR, CPC, outbound clicks | Media buyers, creative strategists |
| Delivery | Is Meta giving the campaign enough stable distribution | Spend, CPM, impressions, reach, frequency | Media buyers, account leads |
This structure makes ownership clearer.
Buyers usually act first on delivery and engagement. Creative teams need attention signals tied to concepts, hooks, and formats. Growth leads need conversion and profitability metrics once enough data has settled. Finance needs stable definitions that match business reporting, not a rotating set of platform columns.
Creative review should not be an afterthought inside a buyer dashboard. If the only report creative sees is spend, clicks, and purchases, feedback comes too late and stays too vague to improve the next round of ads.
A better setup gives creative a small scorecard built for diagnosis. That often includes click-through rate, outbound click rate, hold rate or early video retention, post engagement, and breakdowns by concept or angle. The exact fields matter less than the workflow. Creative and paid teams need to review the same assets against the same naming structure so they can agree on what won.
A practical KPI workflow often looks like this:
That last step matters more in team environments than in solo account management. Enterprise brands and agencies need one source of truth, not four teams defending four versions of performance.
For ecommerce teams, it helps to pair paid media reporting with broader actionable steps for ecommerce KPIs so ad metrics connect to store performance and merchandising reality.
If your team needs a tighter metric framework, this guide to Facebook ad metrics for optimal ROAS and ROI is a useful companion to the KPI hierarchy above.
Team habit: Give creatives a focused report that connects attention signals to concepts, offers, and formats. Leave auction noise out unless it changes the recommendation.
Good KPI reporting does more than summarize results. It helps buyers, creatives, analysts, and stakeholders make the same decision from the same evidence.
One giant report usually means nobody gets what they need.
The buyer wants fast signals. The account lead wants trend context. The executive wants a business readout. If all three audiences get the same dashboard, the buyer gets buried, and leadership gets lost in details that don't change decisions.
The daily view should be short enough to scan before the first meeting of the day. It's for operators.
Focus that report on pacing, delivery shifts, and obvious performance changes. If spend is off, if one campaign is breaking away, or if a creative cluster suddenly weakens, the buyer should spot it immediately. This is also where teams flag tracking anomalies before they contaminate weekly reporting.
A simple daily stand-up works best when it's collaborative. Media buyers flag account changes. Creative notes what new assets went live. Ecommerce or product teams mention site issues, offer changes, or inventory constraints that could affect interpretation.
The weekly review is where marketing leads decide what deserves more budget and what should be paused, refreshed, or restructured. This is the right place to discuss test outcomes, audience fatigue, creative learnings, and spend reallocation across campaigns or accounts.
The monthly review is a different document. Strip it down. Leadership doesn't need every ad set detail. They need a view of contribution, efficiency trend, budget movement, and what actions the team is taking next.
Here's a workable template.
| Cadence | Primary Audience | Key Metrics | Purpose |
|---|---|---|---|
| Daily | Media buyers and channel operators | Spend pacing, delivery status, CTR movement, conversion signal checks | Catch issues early and guide in-flight optimization |
| Weekly | Growth leads, creative leads, account managers | Campaign efficiency, testing outcomes, budget shifts, creative performance themes | Decide where to scale, cut, or iterate |
| Monthly | Executives, finance, senior marketing leadership | Business efficiency, validated conversion trends, budget allocation summary | Connect channel performance to business decisions |
A few rules keep cadence clean:
The right cadence doesn't just save time. It prevents teams from solving monthly questions with daily data.
A paid social lead says Meta hit target CPA. Finance says the month missed. The agency dashboard shows one answer, Shopify shows another, and the CRM tells a third story. That gap usually starts with attribution rules, not bad intent or sloppy analysis.
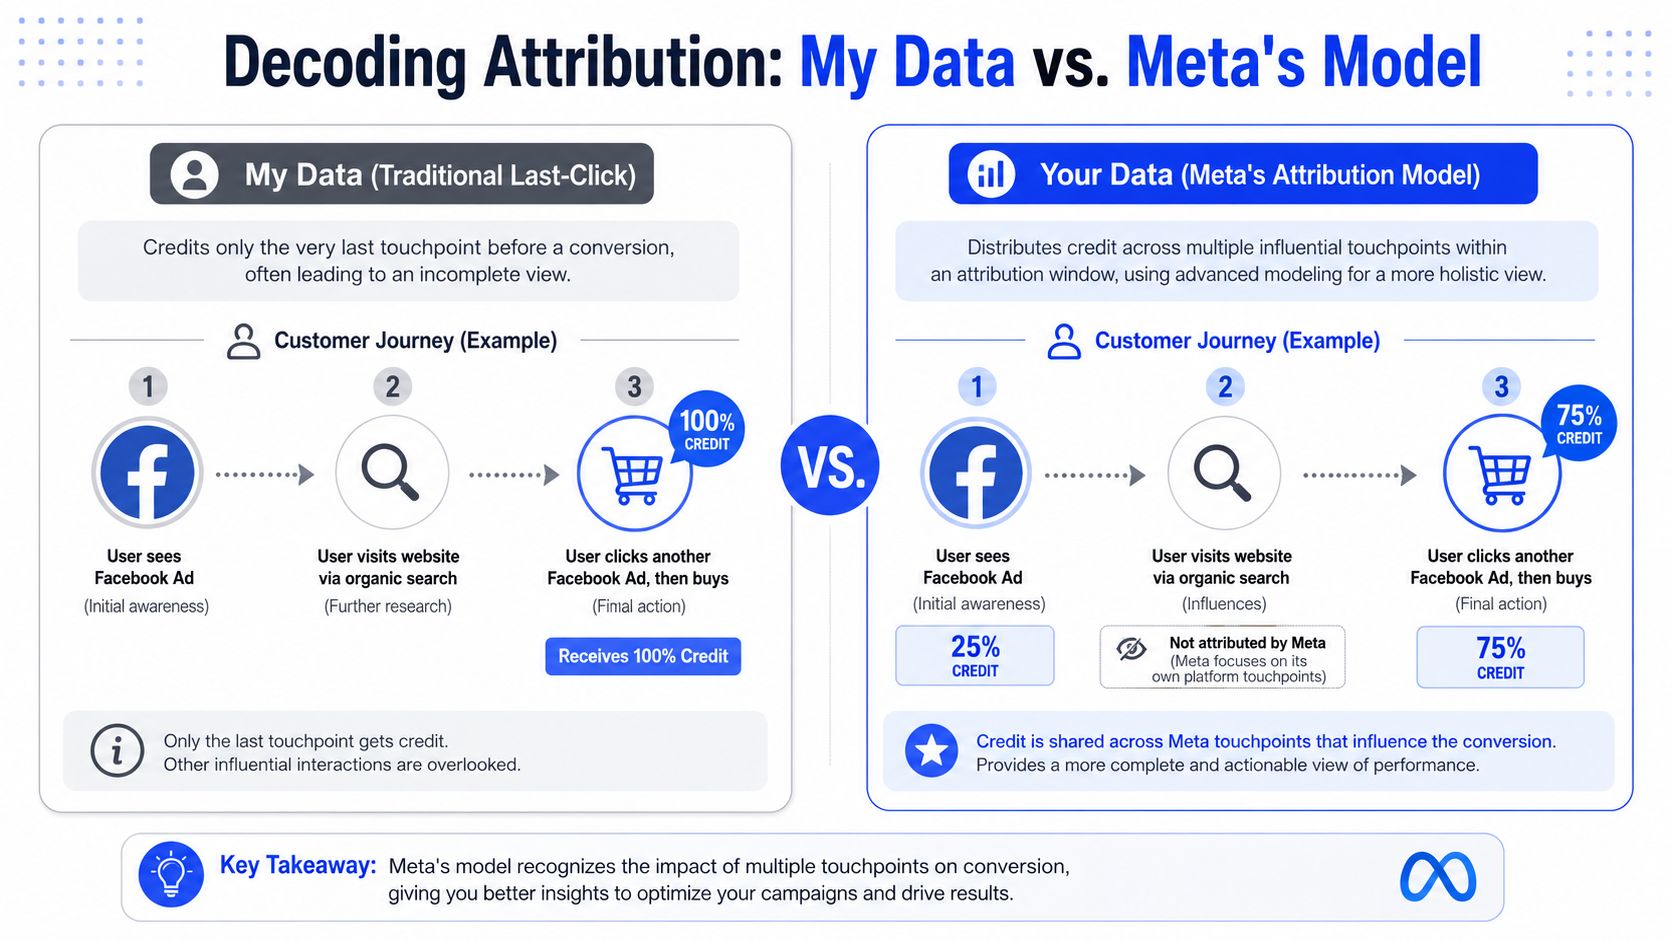
Take a simple path. A customer sees a Facebook ad on Monday and does nothing. On Wednesday, they search the brand, visit the site, and leave. On Friday, they click another ad and purchase.
Each reporting system can assign credit differently because each one answers a different business question. A short attribution window gives more weight to the interaction closest to purchase. A wider window gives more credit to earlier touches that helped create demand. Neither is universally correct.
Teams get into trouble when they compare numbers from different systems as if they were built on the same rules. For in-platform optimization, Meta attribution is often the right view because buyers need to compare campaigns under one consistent method. For financial reconciliation, backend sales data usually has priority because finance and leadership need numbers tied to recorded revenue.
Cross-channel teams also need a shared model for assist value, especially when paid social supports search, email, and direct traffic rather than closing every sale itself. A solid multi-touch attribution modeling guide helps teams build that shared language and move past last-click arguments.
Modeled conversions fill in gaps created by privacy restrictions, browser limitations, and incomplete tracking. They are useful. They are also estimates.
That distinction matters in team reporting. Media buyers can use modeled data to make faster budget and creative decisions inside Meta. Account managers need to explain where those numbers come from. Analysts need to document how they differ from Shopify, GA4, or CRM reporting. Leadership needs to know which number is directional and which number is used for business performance review.
A practical workflow keeps those roles aligned:
This is less about picking one “correct” model and more about governance. Good teams decide which source answers which question, then make sure everyone uses that source for that decision. That prevents the weekly meeting from turning into a debate about whose dashboard is right.
If your team is also tightening event quality and post-click signal flow, this explainer on advertising AI pixel optimization is a useful operational reference.
A mistake is mixing attribution logic inside one reporting conversation. Use one framework for optimization, another for business validation, and make that split visible to every stakeholder who touches the account.
Manual exports work for a freelancer. They break for a team managing many campaigns, markets, or clients.
Once reporting depends on someone downloading CSVs, renaming columns, fixing dates, and stitching tabs together, the process stops being reliable. It also stops being collaborative. Only the person who built the sheet understands where the numbers came from, and everyone else becomes dependent on that person's interpretation.
Meta supports report workflows where teams can create, export, share, and schedule reports, which makes native reporting useful for recurring KPI packs and stakeholder updates, according to Meta's documentation on creating and managing Ads Reporting.
That's helpful, but it doesn't solve the full enterprise problem.
For high-volume reporting, the primary bottleneck is data freshness and schema stability, and automated ETL tooling handles extraction, normalization, incremental syncs, and blending to reduce manual CSV work and avoid schema drift when structures change, according to this guide on analyzing Facebook ads data.
That's the practical shift. Teams don't need more exports. They need a pipeline.
Operational advice: If your weekly report requires copy-paste work, you don't have a reporting system yet. You have a recurring manual task.
A scalable reporting stack should do more than pull spend and conversions. It should preserve naming logic, normalize fields across accounts, align time settings, and blend channel data without breaking every time a platform changes a schema.
In practice, teams usually mix several layers:
If your team is evaluating broader reporting infrastructure, this 2026 guide for analytics automation offers a helpful planning lens for deciding what to automate first.
Video walkthroughs can help teams align on the process before they lock in tooling:
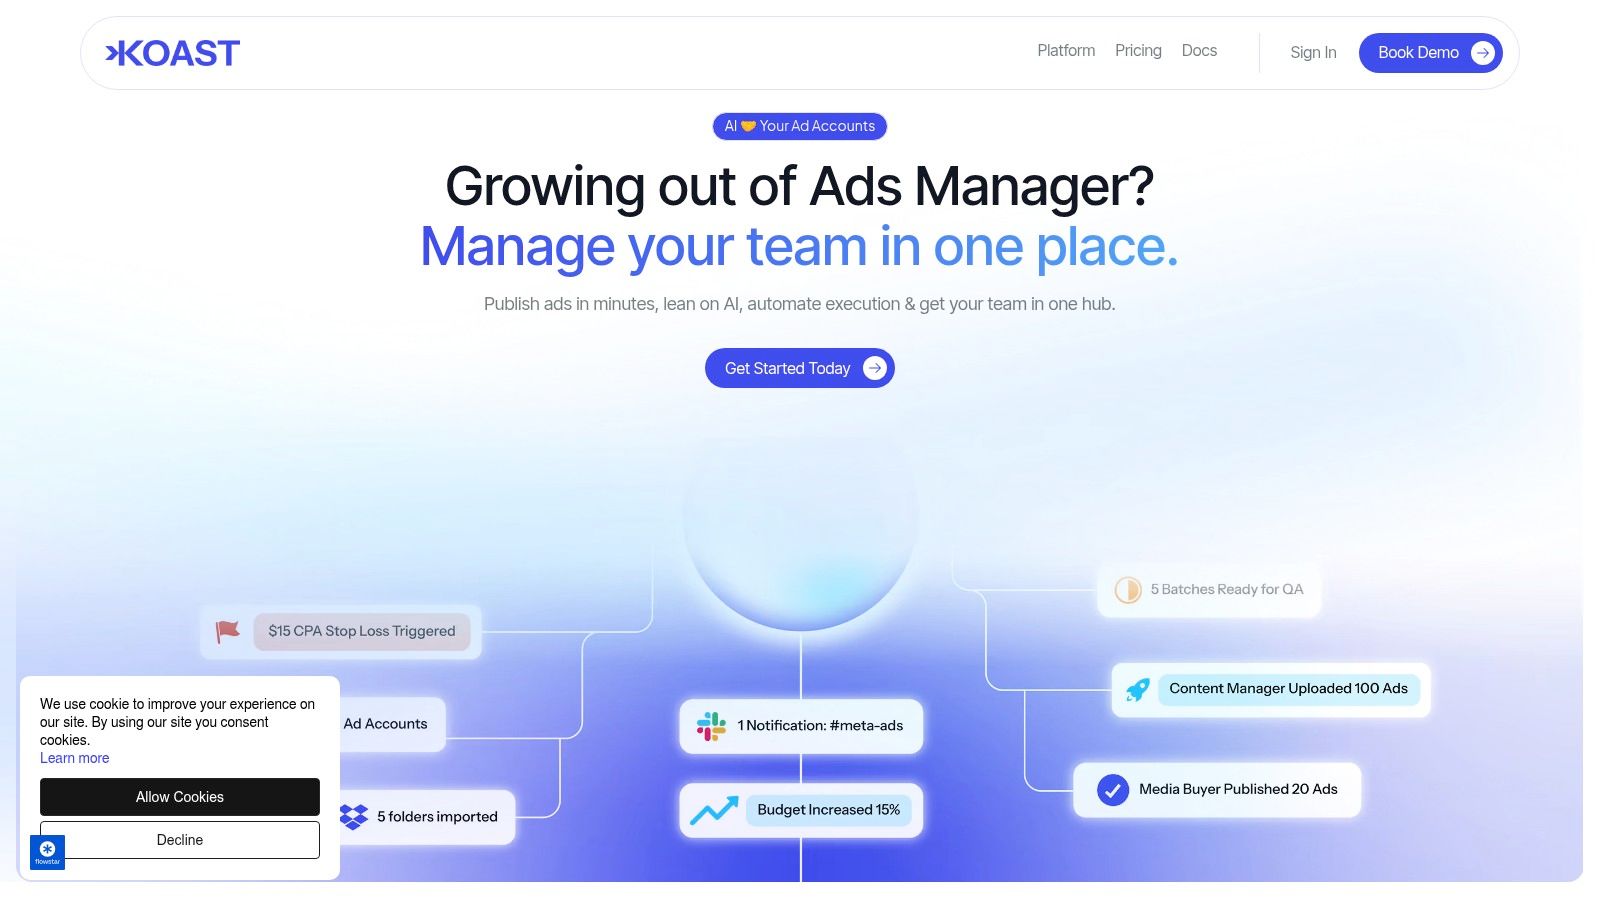
One practical option in this category is marketing automation integration workflows. Koast is relevant when teams want campaign execution, KPI tracking, permissions, and multi-account visibility in one environment rather than spread across disconnected tabs and manual updates.
The point isn't to automate for its own sake. It's to create a reporting environment where media, creative, analytics, and leadership are all reading from the same underlying dataset.
Even after you automate, the numbers still won't match perfectly across tools.
That's normal. Meta itself states that third-party reporting may not match Meta Ads Reporting, and the reasons often include manual exports, schema drift, time-zone mismatches, and cross-channel blending, as noted in Meta's explanation of why third-party reporting can differ.
The mistake is treating every mismatch like a crisis. Most are explainable if the team follows the same diagnostic order every time.
Start with the simple causes before you touch attribution theory.
The best reconciliation process is shared, not delegated.
Have the paid media owner bring the Meta view. Have analytics bring the transformed dashboard view. Have ecommerce or CRM ops bring backend outcomes. Then compare one metric at a time, over the same dates, with the same attribution assumptions.
A few working rules help:
When reporting trust drops, teams slow down. Buyers become hesitant, creatives lose confidence in feedback, and leadership delays budget moves.
Good Facebook Ads reporting doesn't eliminate every difference between systems. It gives the team a repeatable method for explaining those differences without derailing decision-making.
A common reporting failure looks like this: the buyer checks CPA, the creative lead asks which hooks are holding attention, and leadership wants to know whether revenue is pacing to plan. Everyone is looking at the same Meta account, but they are not using the same reporting view for the same job.
Check pacing, delivery stability, spend against plan, and early conversion health. The goal of a daily check is issue detection. It should help the buyer spot broken ads, learning resets, tracking problems, or a sudden rise in costs before those problems spread across the account.
Leadership should see outcome metrics the broader business already accepts, such as spend, revenue, customer acquisition efficiency, and trend direction against target. Keep platform detail in the operating layer. The executive view works best when finance, marketing, and channel owners can all read it the same way.
Yes. Creative review and media optimization are connected, but they are not the same workflow.
Creative teams need a view built around asset-level feedback, not just campaign totals. That usually means watching hook strength, early retention, thumb-stop behavior, saves, shares, comment quality, and the conversion path by asset or concept. Media buyers still need spend, reach, CPA, and conversion value. If both teams work from one flat report, creative feedback gets buried under buying metrics and the team learns more slowly.
As noted earlier, creator-led reporting frameworks often focus more heavily on attention and engagement signals than a standard buyer dashboard does. That difference is useful. It gives creative, media, and leadership separate views tied back to one agreed source of truth.
It is accurate enough for in-platform optimization. It is not the only record a team should use for business reporting.
Use Meta to make buying decisions. Use your backend reporting, finance system, or approved BI layer to confirm business outcomes. Teams run into trouble when they ask one system to do both jobs.
Rarely.
If a dashboard keeps getting rebuilt, the problem is usually upstream. Definitions are loose, naming conventions drift, or the underlying data model changes every quarter. Fix governance first. A stable reporting system comes from agreed metric definitions, clean campaign naming, and ownership across media, analytics, and ops.
They mistake dashboard access for reporting maturity.
A team can have plenty of charts and still argue about what a conversion means, which attribution window applies, or which number goes into the board deck. Strong reporting is shared understanding. Everyone knows which view is for optimization, which view is for business performance, and who signs off on each metric.
Koast fits teams that want Meta campaign execution, permissions, KPI visibility, and reporting workflows in one place instead of spread across ad accounts, sheets, and disconnected dashboards. If your reporting problems are tied to operational sprawl as much as analytics itself, Koast is worth a look.
Your next 30 ad variations are on us. Test drive AdCopy AI today for no charge.


Book a call to have our team launch your first ads with you

.png)
Integrate Meta and begin publishing ads in moments with a free trial of Koast


.svg)
